

 1. Wall
wall 명령어는 리눅스 시스템에서 사용자의 터미널로 메시지를 보내는 방법 중 하나이다.
터미널에 접속 된 사용자라면 누구든지 wall 명령어로 터미널에 메세지를 보낼 수 있다.
util-linux 패키지에서 관리되고 사용되는 명령어이며 기본적으로 설치되어 있다.
Usage
$ wall
Shell
복사
wall 명령어를 입력하여 입력 모드로 진입한다.

전송하고자 하는 Message를 입력한 뒤 Ctrl + D를 입력하여 입력을 정상 종료한다.
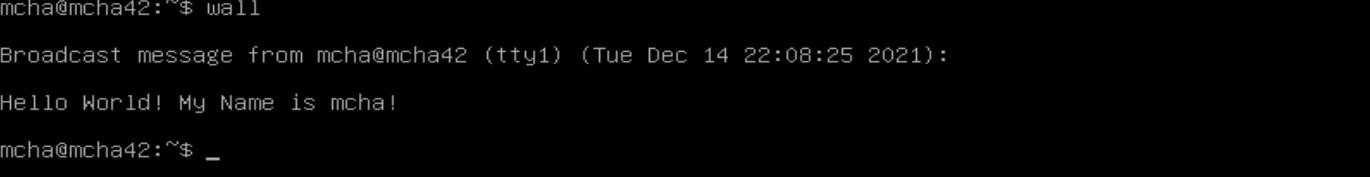
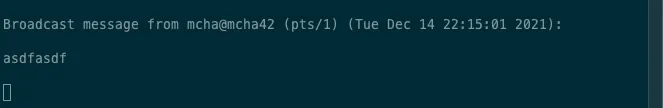
전송한 메시지를 확인할 수 있다.
Reference
2. cron
Summary
cron은 UNIX계열 운영 체제의 시간 기반 잡 스케줄러이다.
소프트웨어 환경을 설정하고 관리하는 사람들은 작업을 고정된 시간, 날짜, 간격에 주기적으로 실행 할 수 있도록 스케줄링 하기 위해 cron을 사용한다.
쉽게 말해 어떤 작업을 주기적으로 자동으로 실행하고 싶다면 cron을 사용하여 스케줄링 작업을 한다.
Description
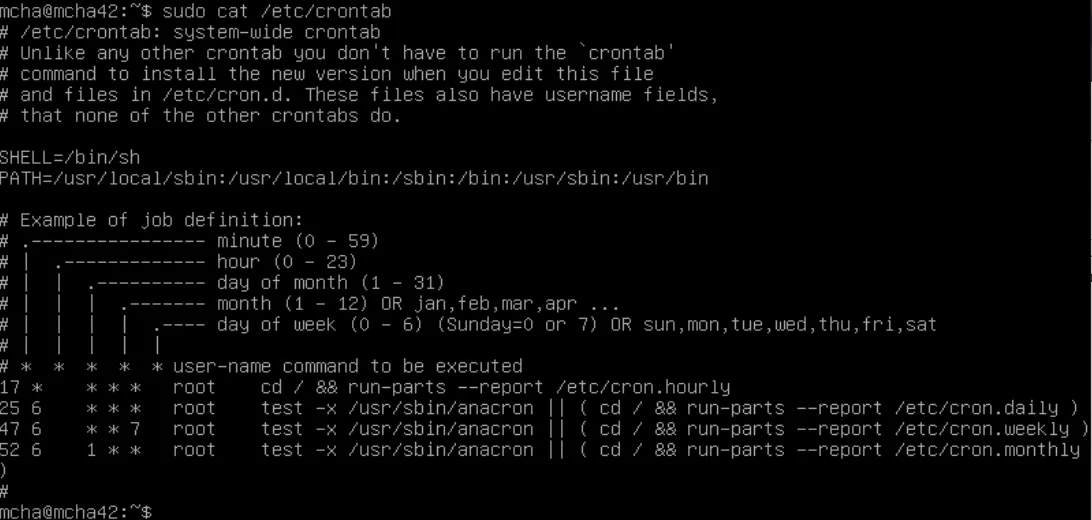
cron은 crontab(cron table) 파일에 의해 구동된다.
이 파일은 Shell 명령어들이 주어진 일정에 주기적으로 실행하도록 규정 해놓은 파일이다.
crontab path : /etc/crontab
사용자를 위한 구성 파일은 crontab -e 를 호출하여 편집 할 수 있다.
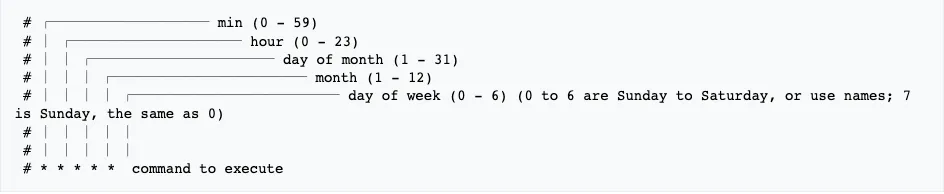
사용 시 문법은 다음과 같다.
# 매일 20시 (오후 8시)에 export_dump.sh라는 shell 프로그램 실행
0 20 * * * /home/oracle/scripts/export_dump.sh
Shell
복사
내 crontab
*/10 * * * * bash /root/monitoring.sh | wall
Shell
복사
Shell File
Location | /root |
File Name | monitoring.sh |
→ The architecture of your operating system and its kernel version.
$ uname -a
Shell
복사
→ The number of physical processors.
$ grep "physical id" /proc/cpuinfo | sort | uniq | wc -l
Shell
복사
→ The number of virtual processors.
$ cat /proc/cpuinfo | grep processor | wc -l
Shell
복사
→ The current available RAM on your server and its utilization rate as a percentage.
$ free -m | grep Mem | awk '{printf "%d/%dMB (%.2f%%)\n", $3, $2, $3/$2 * 100.0}'
Shell
복사
→ The current available memory on your server and its utilization rate as a percentage.
$ df -h | awk '$NF=="/"{printf "%d/%dGB (%s)\n", $3, $2, $5}'
Shell
복사
→ The current utilization rate of your processors as a percentage.
$ top -bn1 | grep load | awk '{printf "%.2f%%\n", $(NF-2)}'
Shell
복사
→ The date and time of the last reboot.
$ who | awk '{print $3" "$4}'
Shell
복사
→ Whether LVM is active or not.
$ cat /proc/net/tcp | wc -l | awk '{print $1-1 " ESTABLISHED"}'
Shell
복사
→ The IPv4 address of your server and its MAC (Media Access Control) address.
$ hostname -I | tr -d '\n''' && ip link | grep "ether " | awk '{print "("$2")"}'
Shell
복사
→ The number of commands executed with the sudo program.
$ cat /var/log/auth.log | grep -c 'COMMAND=' | tr -d '\n'
Shell
복사